NOTE: this blog is still under construction as i am still refining and adding things 🙂
In the beginning of the journey, it may be easy to fall under the trap of ‘analysis paralysis’ since there are so many different things to look out for and consider when analysing a property. The aim of this post is to try come up with a ‘blueprint’ or a systemised way of analysing properties which I can follow, so I don’t fall into the analysis paralysis trap.
It is important to note that these factors are interdependent and you should not base your decision solely off one factor. You should gain an understanding of each of these to understand the bigger picture and help you make an informed decision in your next purchase. Also, for this post as we go through the important factors to look out for in a suburb, we will in parallel also look at a sample suburb, which is actually an area which my parents have invested in so I can think of it as a practical, real-life case study :-D.
Suburb: Mitchelton
Purchased in: 2015
Purchase Price: $520,000
Distance from CBD – 9km
3 Bedrooms / 2 Bathrooms / 1 Car spot
1. Capital Growth
Investing in real estate is primarily about capital growth, so choosing a property which is likely to increase in value is essential. A good first indicator to look at the past performance of the suburb’s capital growth. Here are some resources below:
Resource:
(1) https://www.yourinvestmentpropertymag.com.au
Information:
– Median Capital Growth (12mths)
– Average Capital Growth (10 years)
– Population Growth (5 years)
12 month Capital Growth – 16.09%
Average 10yr Capital Growth – 3.65%
Population – 9k
Population Growth (5 yrs) – 7%
The average capital growth around the area was around 3.65%, which is not great compared to Sydney. I’ve spoken to several investors, with varying opinions:
– some are all for Brisbane as they anticipate future growth there and enjoy the rental yields.
– some are not for Brisbane as they think Sydney’s capital growth properties are the way to go.
However recently, Brisbane and the surrounding suburbs have experienced an incredible boom, as reflected in the 12 month capital growth of 16.09%, which we will explore further down below.
These numbers are good for painting a rough picture of what’s going on, but we can’t just rely on the numbers when thinking about the capital growth of the area. We also need to take other growth indicators into consideration, such as
- Population growth – Population growth can be a good indicator for capital growth, however this is not always the case. For example, some suburbs are new developments such as in Melbourne’s west, Trugunina. Whilst this suburb currently shows high population growth of 33.7% increase in population between 2011 and 2016, this is more due to the influx of new estates. Truginina doesn’t have much capital growth (3.3% over 10 years) when compared with the established and coveted suburbs of Melbourne’s east, such as Balwyn North (11.4% over 10 years) and Camberwell (9.8% over 10 years). It’s important to check the correlation of population growth against the establishment of new estates so that the number doesn’t deceive you.
<I’ll need to see if 7% population growth is good or nah> - New house and land releases – Going off a similar idea as the above point, new house and land packages can be heavily marketed and advertised to be better than what they really are. A tactic used by developers is to release new land and house packages in stages, with each stage increasing in price compared to the previous stage. This tactic causes ‘psuedo’ capital growth. An inflation of price of, say, $20-50k since the last stage may deceive buyers to believe that these suburbs are already experiencing ‘capital growth’ but rather than being an organic capital growth, this is artificial capital growth caused by the developers and causes FOMO in those who are considering purchasing in those areas. Truginina, as described in the above point, exemplifies this. However, this is not always the case such as in the Sydney Hills District, where the suburbs – even with new house and land estates such as Kellyville North – are highly coveted. Sydney is landlocked by mountains and surrounding national parks, and as such, Sydney is running out of room and the price people will pay shows it. In comparison, Melbourne can extend it’s perimeter, and has potential for more and more land and houses to be developed and released.
- Will there be any new developments and/or renovations in the suburb? Will the suburb experience upcoming gentrification? These will be covered in section 7.
- Is the economy in the area stable and what are the jobs in the area? An example of an unstable economy in the area would be mining towns, where the suburbs would be reliant on only that particular industry. It would be ideal to pick a suburb with a diversification of industries. For Mitchelton, I since it is only 9km from the Brisbane CBD I think that a lot of the people may be city folk. I’d need t o confirm this though with a more in-depth analysis of the suburb or maybe ask around. Using Melbourne as another capital city example, a lot of jobs are in Melbourne’s eastern and bayside suburbs. As such the eastern and bayside suburbs experience more capital growth than Melbourne’s western and northern suburbs.
- Are people moving to the area? Find out if there is any reason why people would move to that particular area. In most recent times, we can see that regional NSW towns have experienced more growth with the shifting of the workforce to WFH (work from home) during the pandemic. I would argue that this is our case study suburb Michelton has also experienced such a rapid jump of 16.09% growth in the past year as compared to its previous 3.65% annual return. More Melbourne and Sydneysiders are moving over to QLD as they no longer need to live in the city they work in.
- Population growth – Population growth can be a good indicator for capital growth, however this is not always the case. For example, some suburbs are new developments such as in Melbourne’s west, Trugunina. Whilst this suburb currently shows high population growth of 33.7% increase in population between 2011 and 2016, this is more due to the influx of new estates. Truginina doesn’t have much capital growth (3.3% over 10 years) when compared with the established and coveted suburbs of Melbourne’s east, such as Balwyn North (11.4% over 10 years) and Camberwell (9.8% over 10 years). It’s important to check the correlation of population growth against the establishment of new estates so that the number doesn’t deceive you.
2. Rental Yield
The rental yield of a suburb is a percentage of the gross rental income per annum against the property’s price. Typically, what you would find is that the following types of properties will have higher rental yield:
· Regional properties – as these properties are generally cheaper ($300k – 350k) yet still have rents around the $350 mark, as opposed to a Sydney property costing $600k+ with the same rent price.
· Apartments – since apartments generally a higher rent to value ratio than houses.
If you’re an investor looking for cash flow, then the rental yield may be a good first indicator you may want to look at to screen certain suburbs.
Resource:
(2) https://www.propertyvalue.com.au
Information:
– Median Rent
– Median Gross Yield
Median Sale Price – $743k
Median Rent- $460 pw
Median Gross Yield – 3.2%
Additionally, rental yields can be a good indicator of growth in a suburb. I will refer to an example given in the source below.
If a suburb experiences some development or changes which will drive up the demand, then people will likely begin moving there. Renters are more mobile than owner occupiers, so when people do start moving there it is safe to assume that it is the renters who will get there first, as it is a lot easier to get a lease than to get a mortgage. This will drive up the rents due to remand and hence can be reflected in the rise in the rental yield.
Owner occupiers will also be included as part of the new-comers to the suburb, which will drive up the property prices. However, the first indicator which could have signalled this was the yield.
However, with this in mind there may also be some pitfalls to look out for:
1. The rental yield may only have an increase due to property prices falling
2. Rental yield may only be high if it is a suburb where people want to rent, but not where they want to live – such as mining towns
3. Rental yields may be inaccurate – for e.g. take a suburb with a median house price of $500k and with average rent of $400pw. Maybe in a particular point in time, 10 houses under market value ($400k) get sold, and ten expensive house in the area get rented out ($500pw). Then the rental yield will be way off the average due to this deviation and can reflect an inaccurate representation of the suburb’s true rental yield. It is possible to avoid this pitfall by verifying the gross yield yourself – by checking the types of properties against those being sold in the area you are studying.
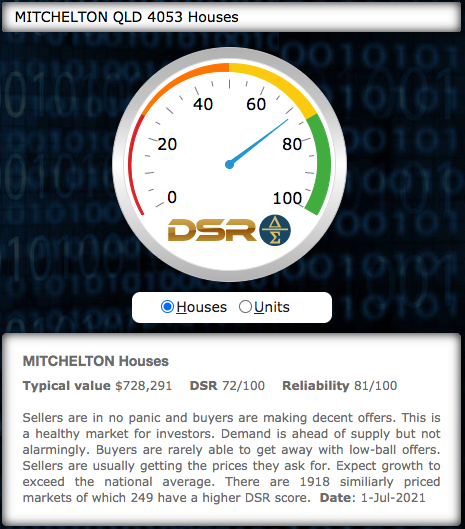
3. Demand to Supply Ratio (DSR)
The higher the demand relative to supply (i.e. the higher the DSR ratio), the better the capital growth. The higher the score, the greater the chance that demand exceeds supply. A DSR between 65-75 would be decent, the higher the better.
Resource:
(3) www.dsrdata.com.au
Information:
– Demand to Supply Ratio (DSR)
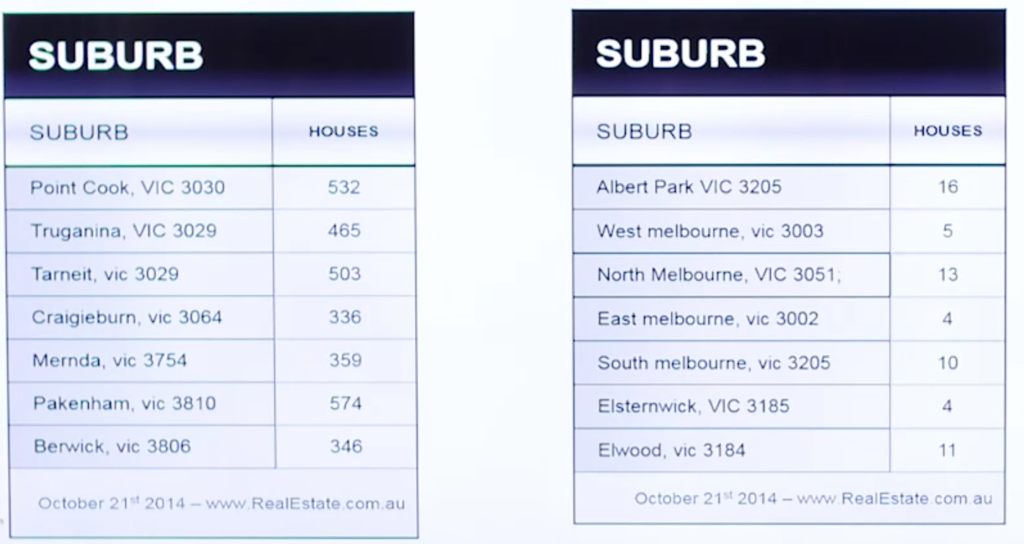
To further highlight the point using Melbourne suburbs as an example, lower capital growth areas of western, northern and far eastern suburbs generally have higher housing listings (table on the left) in comparison to higher capital growth areas of inner, eastern and bayside suburbs (table on the right).
There are some other metrics which you can use to understand Demand vs. Supply in an area, such as the average days on the market and vacancy rates, which are both indicators of buyer and renter demands respectively.
Resource:
(1) https://www.yourinvestmentpropertymag.com.au
Information:
– Average days on the market
– Vacancy rates
Average days on market – 44
Vacancy Rates – 1.6%
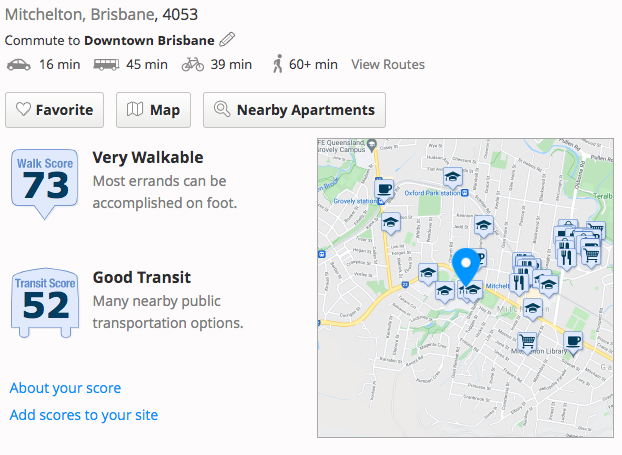
4. Walk Score
Would you pay a premium price for a property where you can conveniently walk to places such as schools, shops, train station, restaurants, gym, etc.? The answer is yes! With the site listed below, you are able to get a ‘walk score’ rating (out of 100) for your specific property.
Note that you do need to put an exact address to get a the most accurate results. You can put in a suburb in general but I think that just is a general average rating for the entire suburb, so doing that wont give you the most accurate results.
Resource:
(4) walkscore.com,au
Information:
– Walk Score out of 100
– Travel Time Map
– Nearby Public Transport Locations
5. Blacklisted Suburbs
There are some suburbs which have been ‘blacklisted’ by some major banks, meaning they may require you to put down as much as 30% deposit for them to lend to you! This is because the banks deem these as ‘risky’ suburbs.
Information:
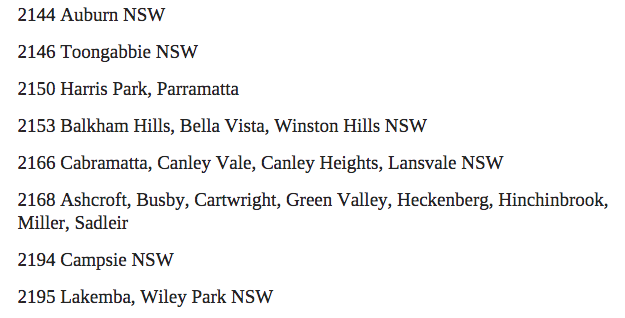
– Blacklisted Suburbs List from NAB in 2016 and Macquarie in 2017 (Note: generally these blacklists are not known to the general public, but from time to time these appear leaked online. At the time of writing this blog, we also had access to Macquarie’s blacklist on Canstar, but it has since been removed from Canstar but you might be able to access it from 5(b) with the web archive link)
Luckily, our sample suburb (Mitchelton, QLD) aren’t on the above blacklists. Phew! Also, it doesn’t look like any surrounding Brisbane suburbs are on the list, which is a good sign for this case study. I’ll include a snippet anyway of some blacklisted suburbs (which is in NSW) below.
There are two main reasons listen on providenceproperty.com.au on why a suburb may appear on the blacklists of some banks:
1. The banks believe a certain suburb has too much supply, with an excess of development being carried out. This could apply to suburbs with high density housing or low density new house and land estates.
2. The banks have too much exposure in one particular suburb. For example, the bank may have lent too much money to investors and/or owner occupiers.
Regarding reason #1, it is safe to say that if the suburb which is on your mind happens to be on the blacklist, it may be a good idea to be cautious about the suburb and do some more due diligence and research. Also, if it is because there is too much supply with a suburb, you can easily do a rough check by using the DSR calculator tool presented above!
Regarding reason #2, this means that blacklisted suburbs can vary between banks as it can potentially be due to the bank’s own personal circumstances, not the potential of a suburb.
To conclude, just because a suburb is on the blacklist, that doesn’t automatically mean it’s a bad suburb to invest in. What I am suggesting is that you should exercise some more caution when thinking about buying there, and do some more additional research.
Also in saying that, even if you do decide that there is a suburb you want to invest in which is on the blacklist but you have the 30% deposit, it still may not be a good idea because you will have all that equity trapped into the property and you won’t be able to take it out to use as a down payment for the next property. As I’ve mentioned a numerous amount of times in my previous property posts, you really need to make sure that the property you obtain will be a good stepping stone to your next.
“You can’t save yourself to wealth, you’ve got to leverage yourself to wealth” – Konrad Bobilak
The source below shows that some suburbs blacklisted by NAB in 2016 have actually performed well:
https://providenceproperty.com.au/property-blacklists-the-truth-behind/
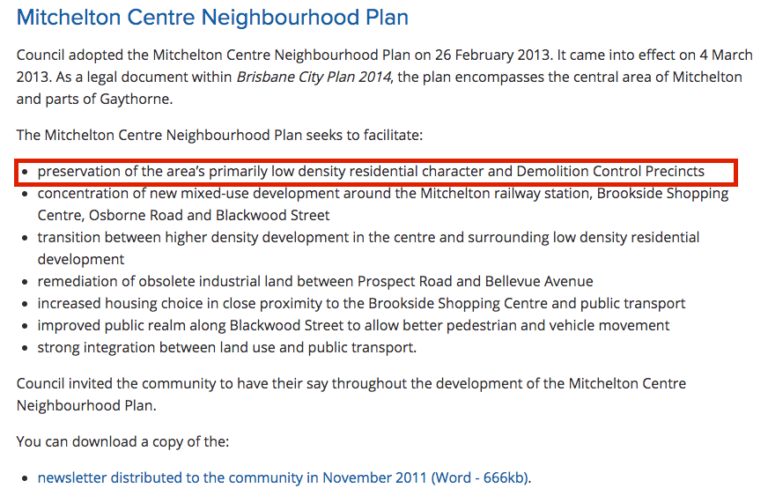
6. Zoning
Understanding the land zoning in an area can be crucial in your decision. For example, it would be beneficial for you to know if, for example, a property with decent land you purchased is zoned for:
– General Residential
– Low Density Residential – perhaps you can build a granny flat or duplex/triplex.
– Low Density Residential – perhaps you can build a set of townhouses.
Also, it is beneficial to know what the zoning around you is. If say you buy unit or townhouse and across the road the block is zoned for high density residential, then you may be risk to experiencing an oversupply of properties and your property may not experience capital growth.
Below are two resources you can use to check for the current zoning in the area.
Resource:
(6a) https://cityplan.brisbane.qld.gov.au/eplan/
Information:
QLD Land Zoning Map
NSW Land Zoning Map
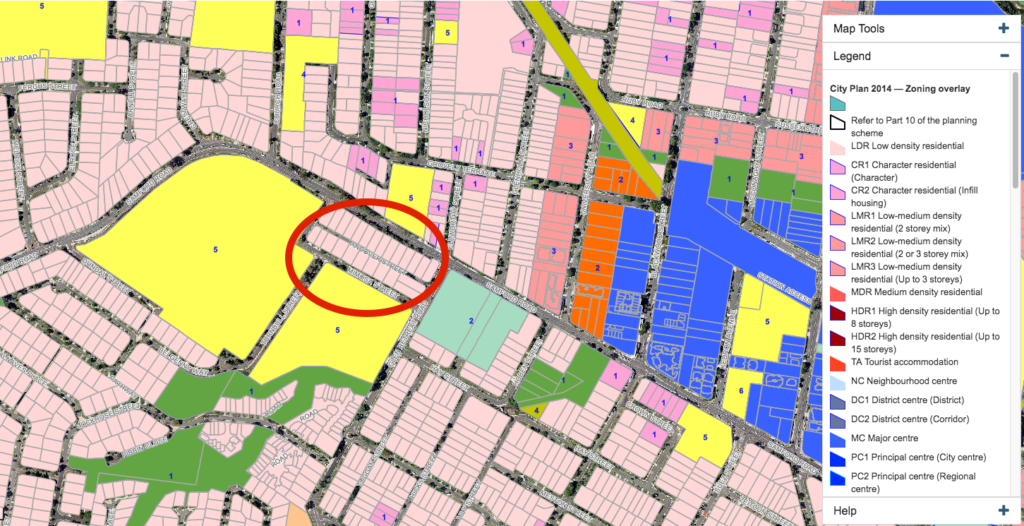
Below is the street of our case study property (circled in red) and the surrounding zoning in the area.
This doesn’t paint the whole picture though. Note that the resources above only show for the current zoning in the area. It does not show the future changes. So with that in mind, this leads us to the next dot point which is understanding the development restrictions around the suburb!
7. Development restrictions around the suburb
I’m sure we all know areas which have large sky rise apartments which just 10 years ago were only houses or empty blocks of land. I used to not think anything of it, but now as a property investor it is something which I would now really need to understand when buying into an area.

This is because as mentioned previously, a high Demand-To-Supply Ratio (DSR) is ideal. This is very similar to the our 5th factor (zoning), however we will go through some more useful sources get a better understanding of the suburb. The suburb’s council will generally report any plans for future changes to a suburb. The below example is given for the suburb of Mitchelton, which is in the suburb of Brisbane.
Information:
– Brisbane Council Planning and Building Information
– Free development map of all known Brisbane projects
7(a) – Brisbane Council Planning & Building Information
7(b) – Free development map of all known Brisbane projects
This resource which I found shows the proposed, approved and projects under construction. It also shows the height of the projects in the 3d interactive map. From the image, we can see that there are not much changes going on. The biggest change is the red thing, which is actually quite tall when zoomed in.
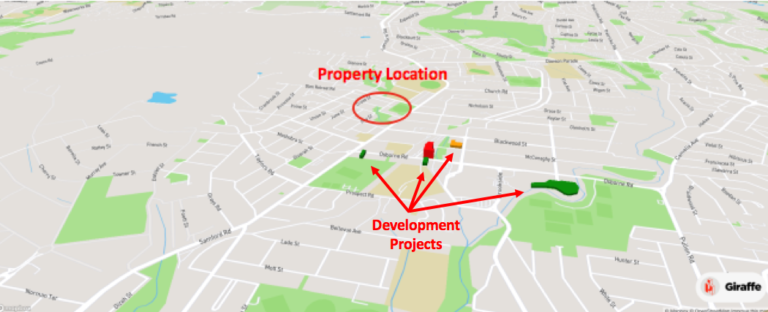
Let’s focus on the red building. When you click on the red building on the map display, it shows the following information on the proposed project:
- Number Of Buildings – 1
- Height – 48 meters
- Floors – 15
- Number Of Apartments – 212
- Car Spaces – 322
So it looks like its a high rise apartment proposed for this location. Let’s look below at what the zoning map shows for this area, and what is currently sitting on this land.
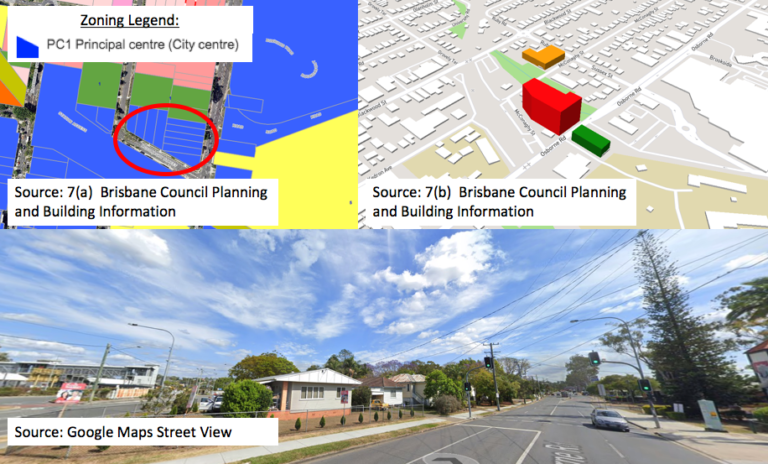
So what we can gather is that they are proposing to build a 15 storey building of apartments on:
· Land which currently just have some houses on it.
· Land which is zoned for a city centre. Although there are houses on it, you can build some shops and stuff if you do end up acquiring that whole block.
I guess it makes sense that they want to propose this megachunk building there since theres a train station really close by! (You can see it to your left in the google map street view image).
So, how does this affect our investment decision? Some examples I can think of from the top of my head are:
· Say you’re thinking about investing in an apartment which is also close to the station. Having an influx of over 200 apartments can really affect your DSR ratio.
· Maybe if your house is on the other side of the road or even next to the new apartment, maybe it may make the house less desirable being close to a big building.
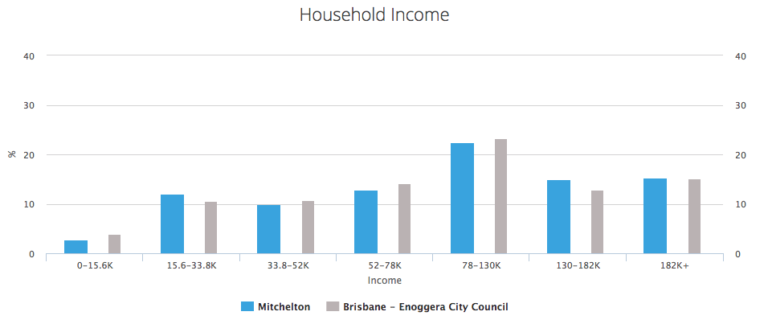
8. Average Household Income Per Week
A higher household income per week is a good indication of showing where the wealthier people are choosing to live, and they may pay above market price for the property. A higher income will reflect a higher socioeconomic class which equals better tenants too.
An example of this is the Melbourne eastern and bayside suburbs, where higher income earners tend to reside, whereas western and northern Melbourne suburbs generally have lower income earners. In terms of capital growth, it is evident that Melbourne’s eastern and bayside suburbs have higher capital growth in comparison to western and northern suburbs as illustrated in section 1.
Resource:
(8) https://www.propertyvalue.com.au
Information:
– Household Income